The Sub Coverage Report provides visibility into shift swap activity across your organization - featuring overall coverage metrics, last-minute requests, pickup rates, response times, and trends over a selected date range. It can be viewed at both the workspace level to identify locations driving the most sub activity and key contributors, or at the individual level to pinpoint team members with frequent sub requests, high last-minute rates, responsiveness, and potential coverage risk.

From the Prospr Dashboard, scroll down to the Schedule Activity Log.
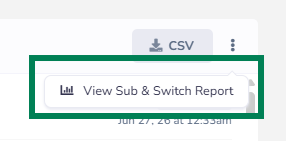
Click the three-dot (⋮) menu on the right side
Select View Sub & Switch Report.
You will be taken to the Sub Coverage Report page.
Total sub requests
Last-minute sub request rate
Total pickups completed
Average time to first acceptance
High-risk staff
Last-minute requests
Recurring shift slots
Sub-outs with no pickups
Unanswered direct-swap invites
Team member name
Assigned location
Coverage risk level
Total sub-outs submitted
Total pickups completed
Last-minute sub-out percentage
Attendance/subbing patterns (when applicable)
Responsiveness (acceptance/response rate)
Date of most recent sub-out
Location/studio name
Total scheduled shifts
Total shifts subbed out
Overall sub rate
Last-minute sub rate
Top contributors to sub volume
Subbing trend over time
Custom date range
Preset date ranges (7, 30, 90 days, current month, last month)
Location filtering
Team member search
CSV export/download of report data